NVIDIA Toolkit
约 1359 个字 206 行代码 3 张图片 预计阅读时间 8 分钟
CUDA
TensorRT
tar -xzvf TensorRT-10.5.0.18.l4t.aarch64-gnu.cuda-12.6.tar.gz
通过上面命令解压之后,会得到一个TensorRT-10.5.0.18文件夹,然后执行如下两条命令:
cd TensorRT-10.5.0.18/samples/sampleOnnxMNIST
make
会在 /usr/local/TensoRT-10.5.0.18/targets/aarch64-linux-gnu/bin/ 文件夹下得到一个sample_onnx_mnist的可执行文件,我们运行它后,会提示不能链接到libnvinfer.so.8的库:
运行 sample_onnx_mnist 出现缺库现象
export LD_LIBRARY_PATH=/usr/local/TensorRT-10.5.0.18/targets/aarch64-linux-gnu/lib:$LD_LIBRARY_PATH
这时候,我们通过命令 export 将 tensorrt 的库添加到环境变量中,再次运行 sample_onnx_mnist,会得到如下输出即表明 tensorrt 安装成功
cuDNN
cuBLAS
cuSOLVER
NVTX
使用 
案例 
import time
import nvtx

@nvtx.annotate(color="blue")
def my_function():
    for i in range(5):
        with nvtx.annotate("my_loop", color="red"):
            time.sleep(i)

my_function()
Nsight System 下载 
Acknowledgements
视频教程:
安装教程:
- isaid22/Nvidia-Nsight-Systems-Setup: Shows how to set up Nsight
- Jetson Nano - Nsight Systems target not supported - Nsight Systems / Profiling Embedded Targets - NVIDIA Developer Forums
- How to use Nvidia Nsight Systems remote session using SSH - Nsight Systems / Profiling Linux Targets - NVIDIA Developer Forums
使用案例:
nsys 是 NVIDIA Nsight Systems 的命令行工具,可以用于分析 CUDA 应用程序的性能和行为
安装 
下载地址为:https://developer.nvidia.com/nswight-systems。
chmod +x <installer-name>.run
./<installer-name>.run
添加 nsys 到系统的 PATH 环境变量中。为了能够在终端中直接使用 nsys 命令,您需要将安装目录中的 bin 文件夹添加到系统的 PATH 环境变量中。可以使用以下命令将 nsys 添加到 PATH 环境变量中:
export PATH="/opt/nvidia/nsight-systems/bin:$PATH"
nsys profile –trace=cuda,cudnn,cublas,osrt,nvtx python demo.py
profile - CLI - 基本使用 
nsys profile -y 30 \
--trace=cuda,osrt,nvtx \
--trace-fork-before-exec=true \
--cuda-graph-trace=node \
vllm serve /home/user/latency-attack/model/qwen3_0.6B \
    --host 0.0.0.0 \
    --port 8080 \
    --dtype auto \
    --max-num-seqs 32 \
    --max-model-len 4096 \
    --tensor-parallel-size 1 \
    --gpu-memory-utilization 0.85
简单理解:nsys profile [options] <application> 会启动一个应用并对它进行系统级和 CUDA 级的性能分析。常用参数分几类:
采样与回溯
-b, --backtrace=:控制采样时是否收集调用栈,默认lbr(低开销硬件支持) ,也可以fp、dwarf或none。-s, --sample=:是否做 CPU IP/backtrace 采样(process-tree、system-wide、 none) 。--sampling-period=:CPU 采样周期(默认 1,000,000 cycles) 。
控制采集范围
-cor--capture-range:决定什么时候开始采集(如cudaProfilerApi,nvtx,hotkey) 。--capture-range-end:采集范围结束后的行为,比如stop、repeat等。--durationor-d:直接设置采集时长(秒) 。
CUDA 相关
-tor--trace=:选择要跟踪的 API,默认cuda,nvtx,osrt,opengl。 例如--trace=cuda,cublas,cuDNN。--cuda-event-trace=:跟踪 CUDA Event,同步点。--cuda-memory-usage=:跟踪 GPU 内存使用情况。--cuda-trace-all-apis=:是否采集所有 CUDA API。--cudabacktrace:给特定 CUDA API 调用收集 backtrace。--cuda-um-*:跟踪 unified memory 的 CPU/GPU page fault。
GPU / 系统指标
--gpu-metrics-devices=:采集 GPU 指标(默认 none,可以选all或具体 GPU ID) 。--gpu-metrics-frequency=:GPU 指标采样频率(Hz,默认 10000) 。--nic-metrics=:采集网络适配器指标。--storage-metrics=:采集存储吞吐指标(实验性) 。
Python / 深度学习支持
--python-functions-trace=:指定 JSON 来跟踪 Python 函数(PyTorch、Dask 已有预设) 。--pytorch=:启用 PyTorch 特殊标记,如autograd-nvtx。--dask=:类似,用于 Dask。
输出
-o, --output=:结果文件前缀(默认report1) 。--export=:选择额外的导出格式(sqlite,json,text等) 。--stats=:是否生成汇总统计。
✅ 常用命令示例(假设要分析一个 PyTorch 脚本 train.py
nsys profile -o result --trace=cuda,cublas,cudnn,nvtx,osrt \
  --gpu-metrics-devices=all \
  python train.py
✅ 只在代码里调用 cudaProfilerStart/Stop 时采集:
nsys profile -c cudaProfilerApi -o result python train.py
✅ 采集 30 秒并导出 SQLite 和 JSON:
nsys profile -d 30 -o result --export=sqlite,json python train.py
GUI - 基本使用 
- zoom in:
- 选中区域
shift + z - ctrl+ 滚轮 / command + 滚轮
- 选中区域
- option/alt + 滚轮:水平移动
backspace返回上一个视图
GUI - SSH 连接 
问题 
测试 
用 GPT 写了一个使用 NVTX 打标的,带有 CUDA 命令交互 的程序,用于测试环境配置,代码如下
NVTX CUDA demo
#!/usr/bin/env python3
# -*- coding: utf-8 -*-

"""
NVTX + CUDA 测试程序(Python)
- 自动选择后端:PyTorch -> CuPy -> Numba
- 在关键阶段打 NVTX 区段(range)与点标记(marker)
- 进行一次 warmup,再进行多次重复以便观察
"""

import time
import math

# ---- NVTX(CPU 侧区段/标记)----
try:
    import nvtx
except Exception as e:
    raise SystemExit(
        "未找到 nvtx 库,请先安装:\n  pip install nvtx\n原始错误:%s" % e
    )

REPEATS = 5
N = 1_000_000  # 元素数量,可调大以拉开时间
DEVICE_ID = 0

def now_ms():
    return time.perf_counter() * 1000.0

def with_nvtx_range(name):
    # 轻量包装,统一风格
    return nvtx.annotate(message=name, domain="demo")

def torch_backend():
    import torch

    if not torch.cuda.is_available():
        raise RuntimeError("PyTorch 可用,但未检测到 CUDA 设备。")

    torch.cuda.set_device(DEVICE_ID)
    # 也用 torch 自带的 NVTX(作用等价于 nvtx.annotate)
    from torch.cuda import nvtx as tnvtx

    with with_nvtx_range("torch:init"):
        a = torch.rand(N, device="cuda")
        b = torch.rand(N, device="cuda")
        c = torch.empty_like(a)

    # warmup
    with tnvtx.range("torch:warmup"):
        c = a + b
        torch.cuda.synchronize()

    # 重复多次,便于观察
    for i in range(REPEATS):
        with tnvtx.range(f"torch:iter_{i}:compute(+sync)"):
            c = a + b
            torch.cuda.synchronize()
        nvtx.mark(message=f"torch:iter_{i}:done", domain="demo")

    # 额外做一次小的归约,拉起 cuBLAS/cuDNN 之外的内核
    with tnvtx.range("torch:reduce(sum)+sync"):
        s = torch.sum(c)
        torch.cuda.synchronize()

    # 防止优化器消除
    print("torch sum:", float(s))

def cupy_backend():
    import cupy as cp
    from cupy.cuda import nvtx as cnvtx

    cp.cuda.Device(DEVICE_ID).use()

    with with_nvtx_range("cupy:init"):
        a = cp.random.random(N, dtype=cp.float32)
        b = cp.random.random(N, dtype=cp.float32)
        c = cp.empty_like(a)

    # warmup
    with cnvtx.RangePush("cupy:warmup"):
        c = a + b
        cp.cuda.runtime.deviceSynchronize()
    cnvtx.RangePop()

    for i in range(REPEATS):
        cnvtx.RangePush(f"cupy:iter_{i}:compute(+sync)")
        c = a + b
        cp.cuda.runtime.deviceSynchronize()
        cnvtx.RangePop()
        nvtx.mark(message=f"cupy:iter_{i}:done", domain="demo")

    with cnvtx.RangePush("cupy:reduce(sum)+sync"):
        s = float(cp.sum(c).get())
        cp.cuda.runtime.deviceSynchronize()
    cnvtx.RangePop()

    print("cupy sum:", s)

def numba_backend():
    import numpy as np
    from numba import cuda

    cuda.select_device(DEVICE_ID)

    @cuda.jit
    def vadd(x, y, z):
        i = cuda.grid(1)
        if i < x.size:
            z[i] = x[i] + y[i]

    threads = 256
    blocks = math.ceil(N / threads)

    with with_nvtx_range("numba:host_init"):
        ha = np.random.rand(N).astype(np.float32)
        hb = np.random.rand(N).astype(np.float32)

    with with_nvtx_range("numba:to_device"):
        da = cuda.to_device(ha)
        db = cuda.to_device(hb)
        dc = cuda.device_array_like(da)

    # warmup
    with with_nvtx_range("numba:warmup(+sync)"):
        vadd[blocks, threads](da, db, dc)
        cuda.synchronize()

    for i in range(REPEATS):
        with with_nvtx_range(f"numba:iter_{i}:kernel(+sync)"):
            vadd[blocks, threads](da, db, dc)
            cuda.synchronize()
        nvtx.mark(message=f"numba:iter_{i}:done", domain="demo")

    with with_nvtx_range("numba:copy_back"):
        hc = dc.copy_to_host()

    print("numba sum sample:", float(hc[:5].sum()))

def main():
    started = now_ms()
    print("NVTX CUDA demo start")

    # 优先顺序:torch -> cupy -> numba
    for name, runner in [
        ("PyTorch", torch_backend),
        ("CuPy", cupy_backend),
        ("Numba", numba_backend),
    ]:
        try:
            with with_nvtx_range(f"backend:{name}"):
                runner()
            print(f"使用后端:{name}")
            break
        except Exception as e:
            print(f"[跳过 {name}] 原因:{e}")
    else:
        raise SystemExit(
            "未找到可用的 CUDA Python 后端(PyTorch / CuPy / Numba 任一)。\n"
            "请先安装其中之一,并确保 CUDA 驱动可用。"
        )

    print("Total elapsed: %.2f ms" % (now_ms() - started))

if __name__ == "__main__":
    main()
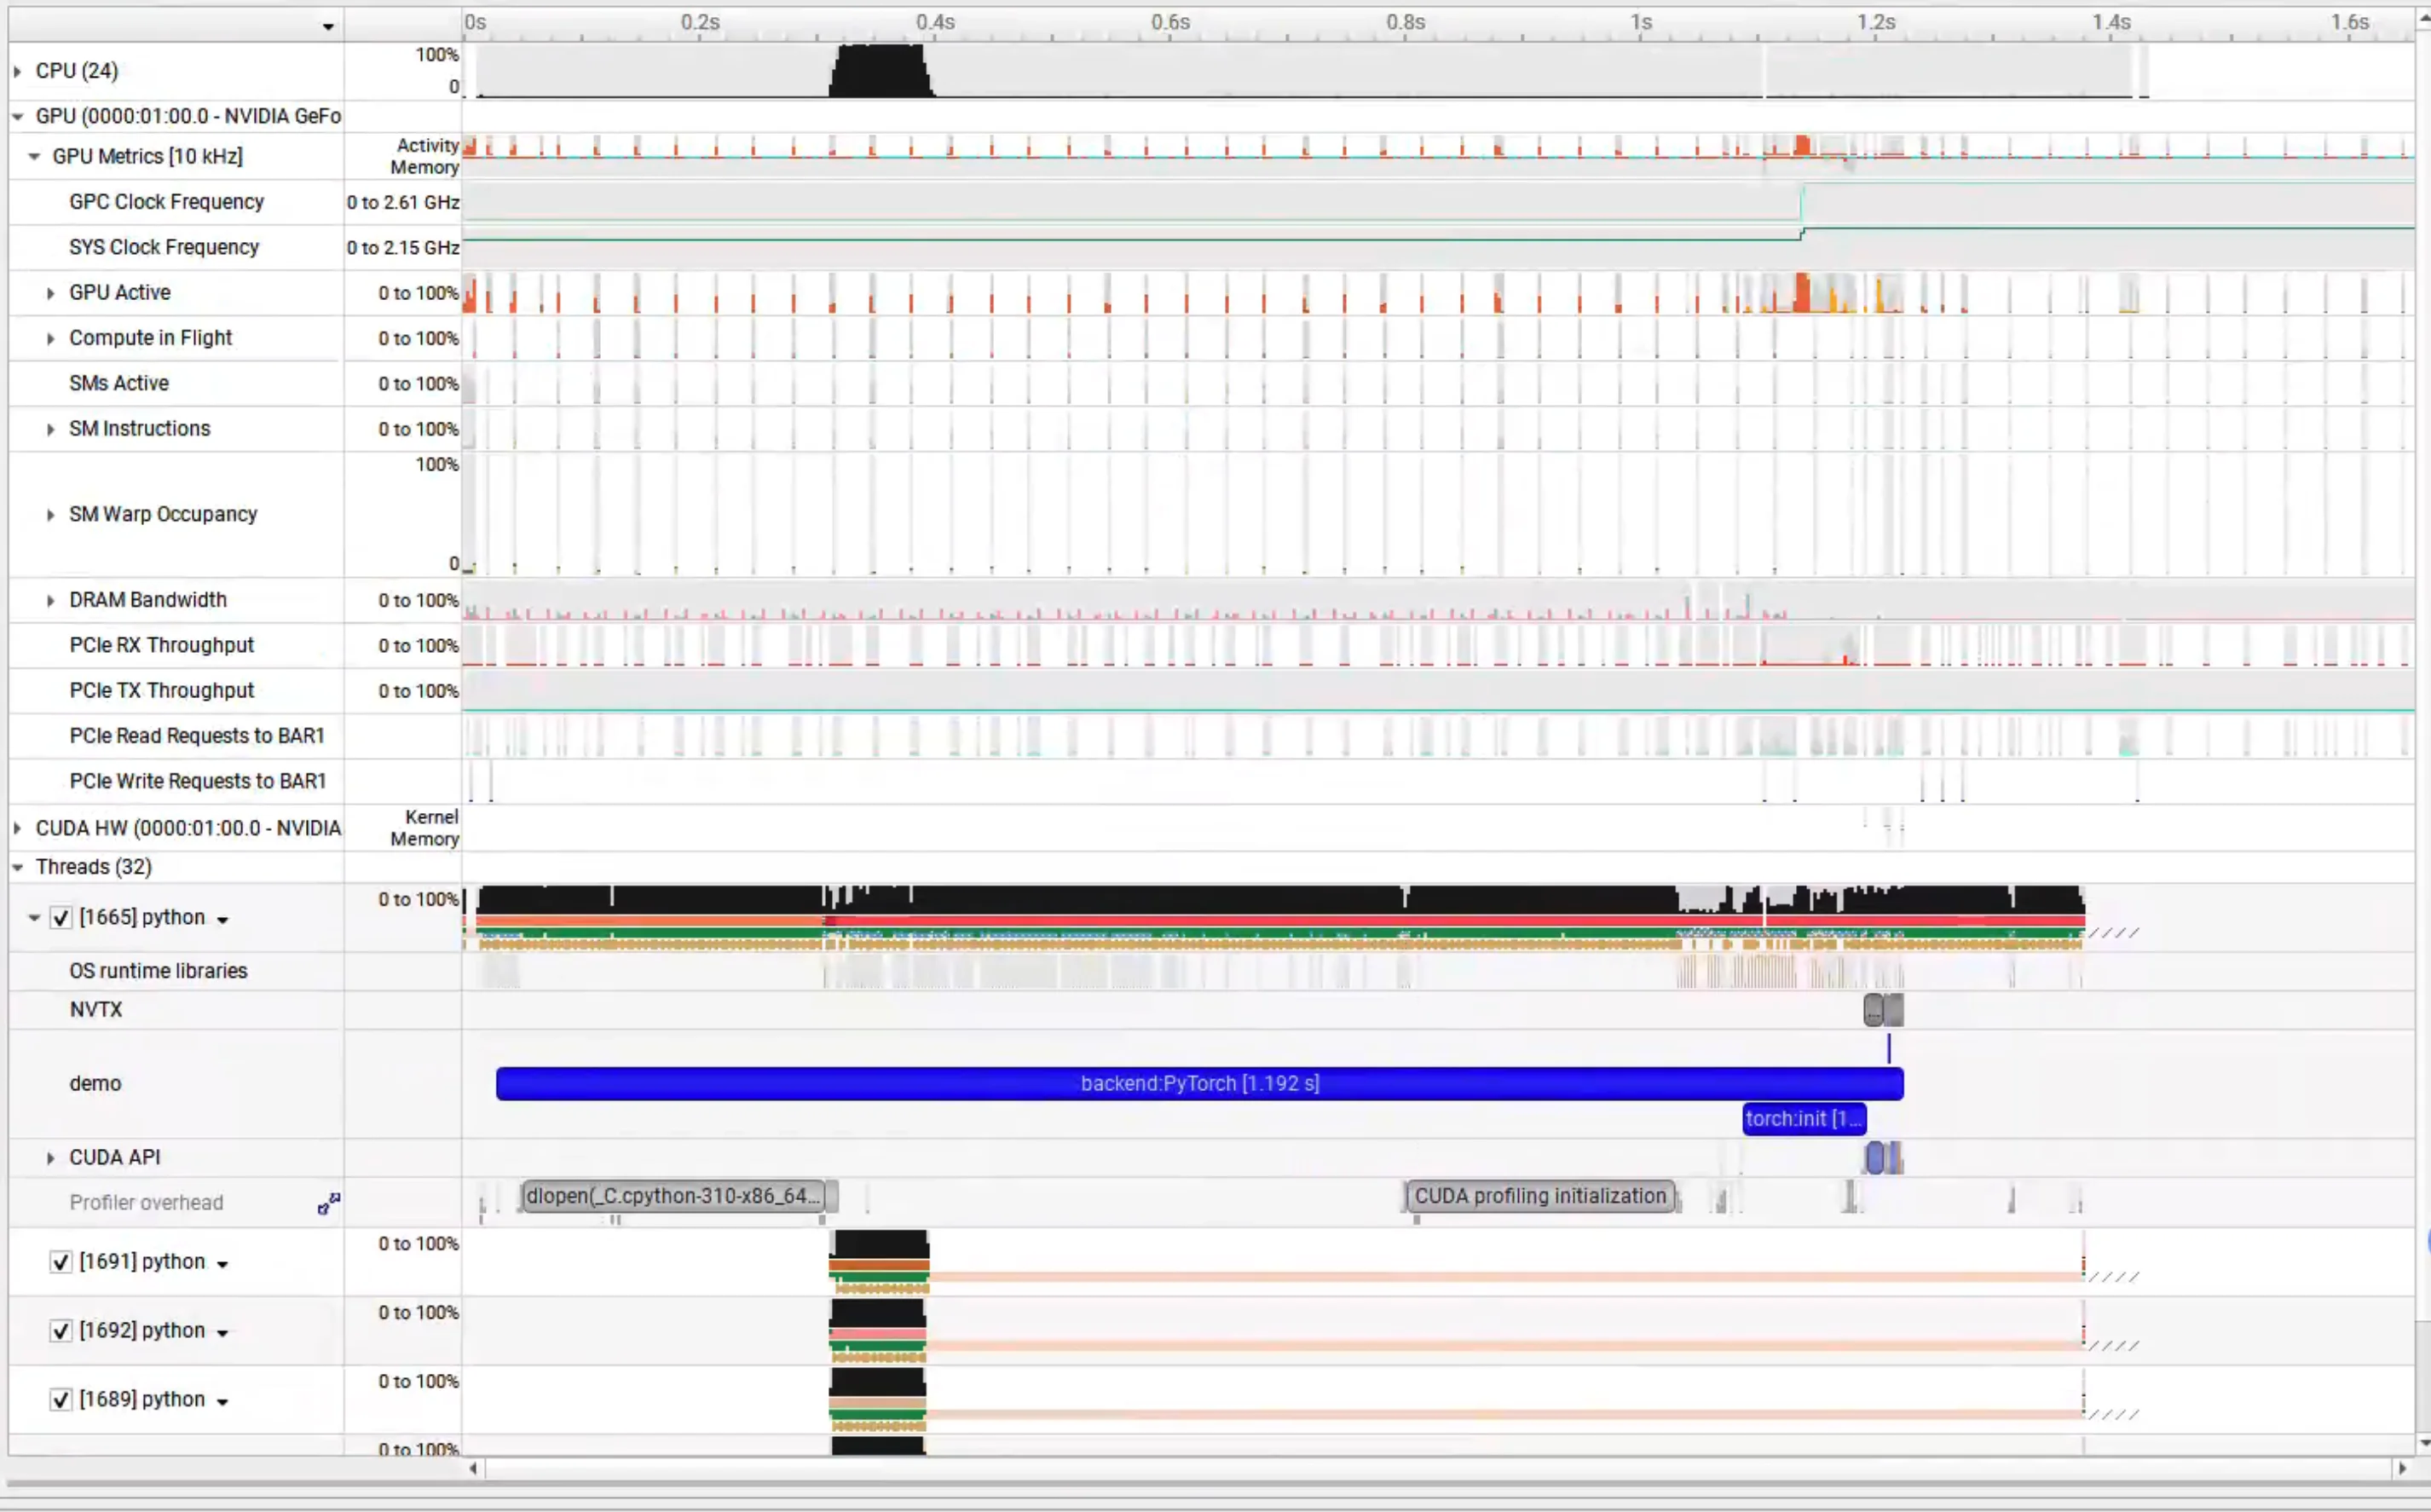
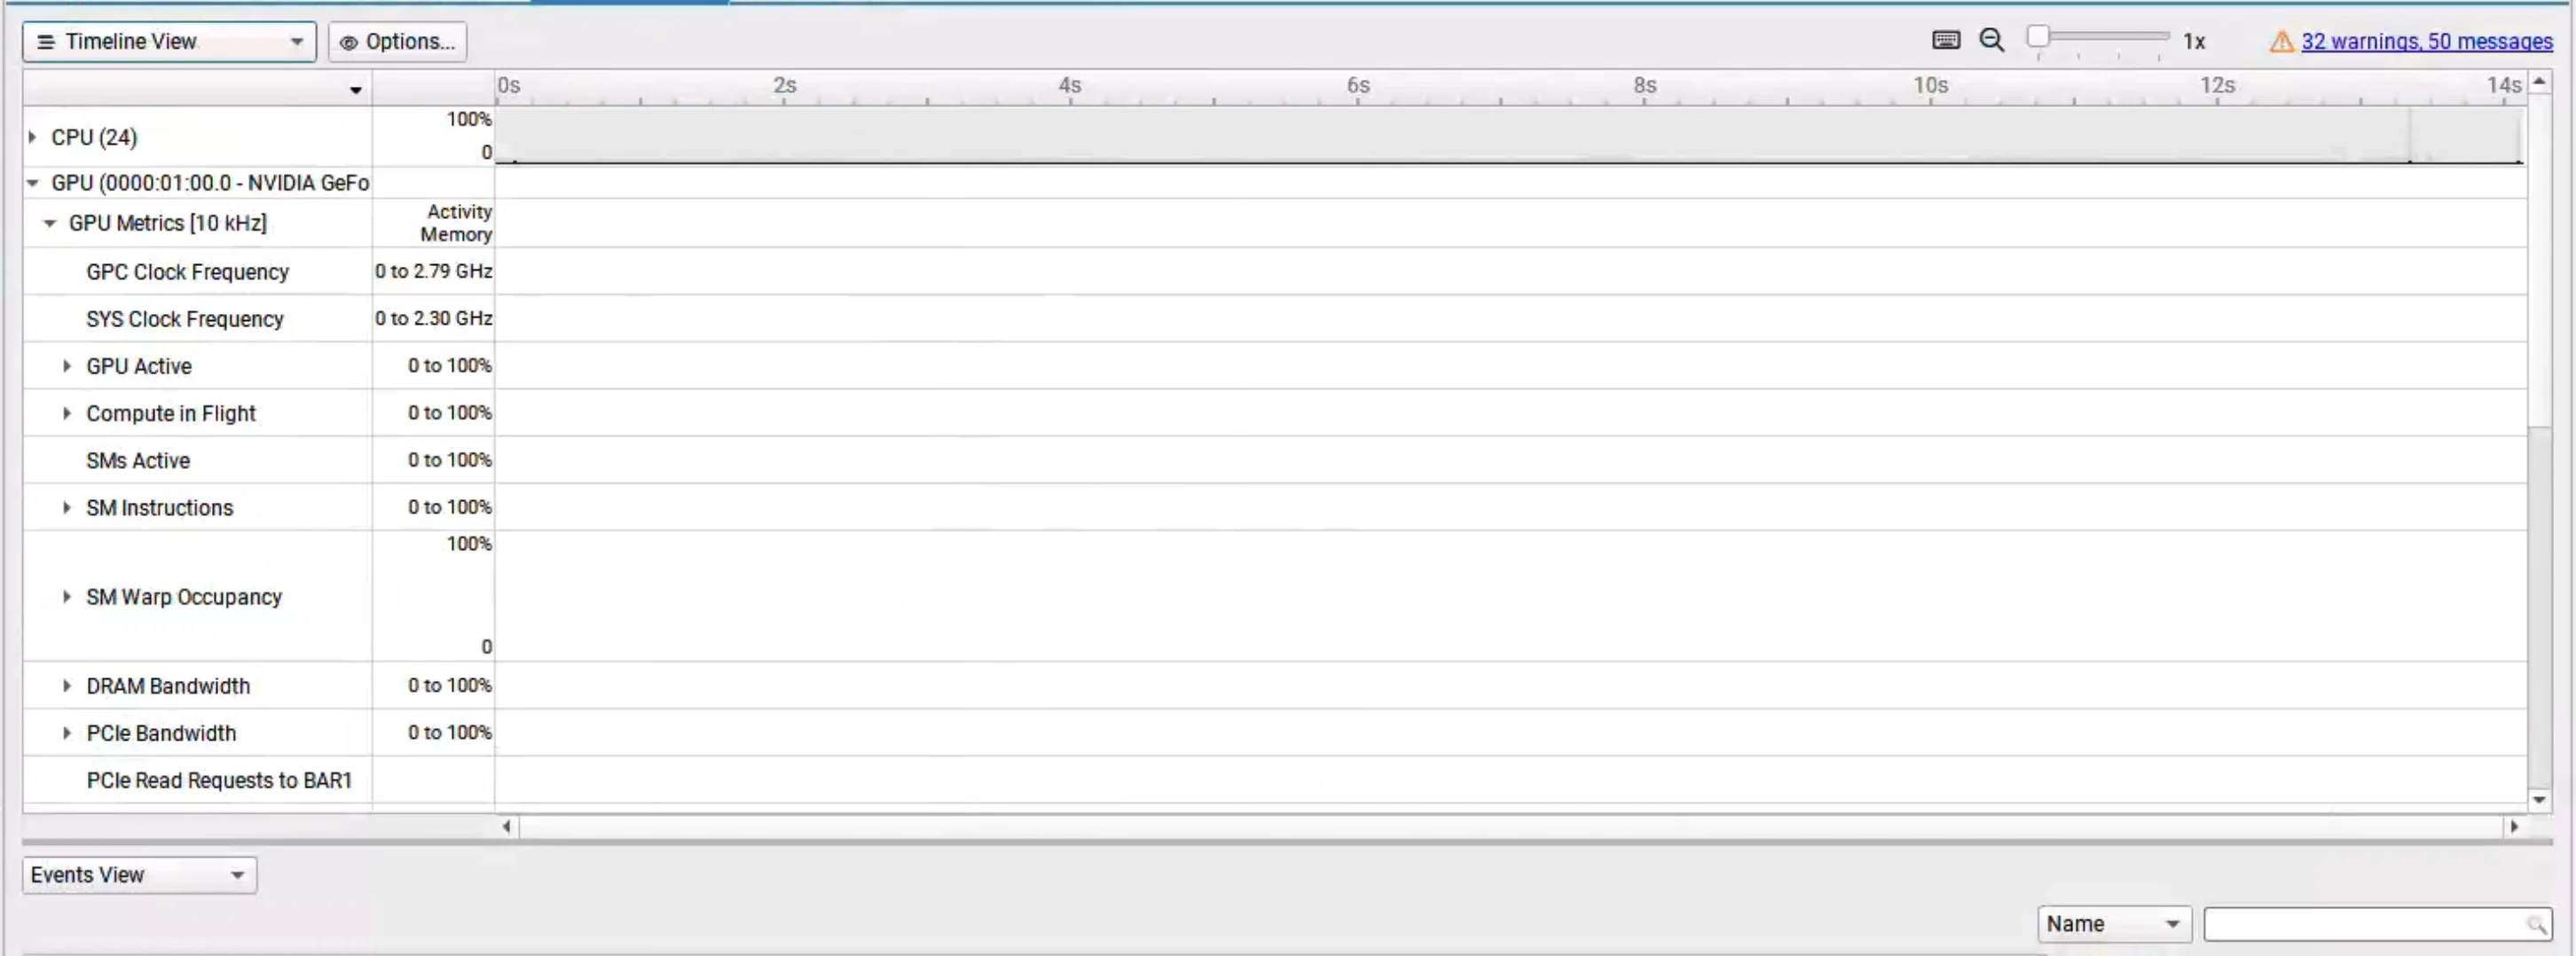
正常运行后,应该显示类似如下图的结果
版本问题 
路径问题 
无法连接 GPU 
遇到的问题是CUDA device 0: Unified Memory cannot be traced on devices that don't support peer-to-peer transfers.Please verify that SLI/NVLink is functioning properly.且 GPU 没有抓取到信息
我的使用环境是:在 windows 上运行 Nsight System,使用 ssh 连接 wsl 虚拟机,进行连接
首先检查安装问题
nvcc --version
nsys --version
nvidia-smi
其次检查 windows 端有没有打开

最后找到了官方论坛上关于这个问题的讨论,Nsight system error : Unified Memory cannot be traced on devices that don't support peer-to-peer transfers - NVIDIA Developer Forums
给出了下面的解决方法
$ nsys -z
/home/liuyis/.config/NVIDIA Corporation/nsys-config.ini
Create the config.ini file if it does not already exist. Note the path might have a space in it so it needs to be wrapped by quotes
mkdir -p "/home/liuyis/.config/NVIDIA Corporation"
touch "/home/liuyis/.config/NVIDIA Corporation/nsys-config.ini"
Add a line in the config file:CuptiUseRawGpuTimestamps=false
echo "CuptiUseRawGpuTimestamps=false" > "/home/liuyis/.config/NVIDIA Corporation/nsys-config.ini"
但是没有解决问题
无法打开 vllm 
[Bug]: nsys cann't open the file · Issue #19903 · vllm-project/vllm
无法显示 CUDA 信息 
[Bug]: nsys profiler failed to collect CUDA events on vLLM 0.9.2 · Issue #20959 · vllm-project/vllm
[Core] Nsys can't capture any information · Issue #42139 · ray-project/ray
多进程只有主线程显示 CUDA 信息 
–event-sample=system-wide
Not really, this only enables the “event sampling” feature, which indirectly enabled the “CPU sampling” feature and that’s why you can see the background Python process and the callstack in my screenshot. However, for trace features like CUDA trace, OSRT trace, there is no system-wide support and the process has to be launched by Nsys.
Nsys does not support attaching to running processes. You’ll need to launch the process through Nsys, i.e. something like nsys profile --trace=osrt,cuda <the background app that run CUDA workload>
多卡无法显示 CUDA 信息 
[Misc]: nsys profile can not show CUDA HW on all devices · Issue #10708 · vllm-project/vllm
无法连接 CPU 
Unable to collect CPU kernel IP/backtrace samples. perf event paranoid level is 2. Change the paranoid level to 1 to enable CPU kernel sample collection.
sudo sh -c 'echo 1 >/proc/sys/kernel/perf_event_paranoid'
to change the paranoid level to 1.