03 | 小作文 
约 774 个字 17 张图片 预计阅读时间 3 分钟
图表类小作文 
Acknowledgement
- 折线图 Line Graph
- 柱状图 Bar Chart
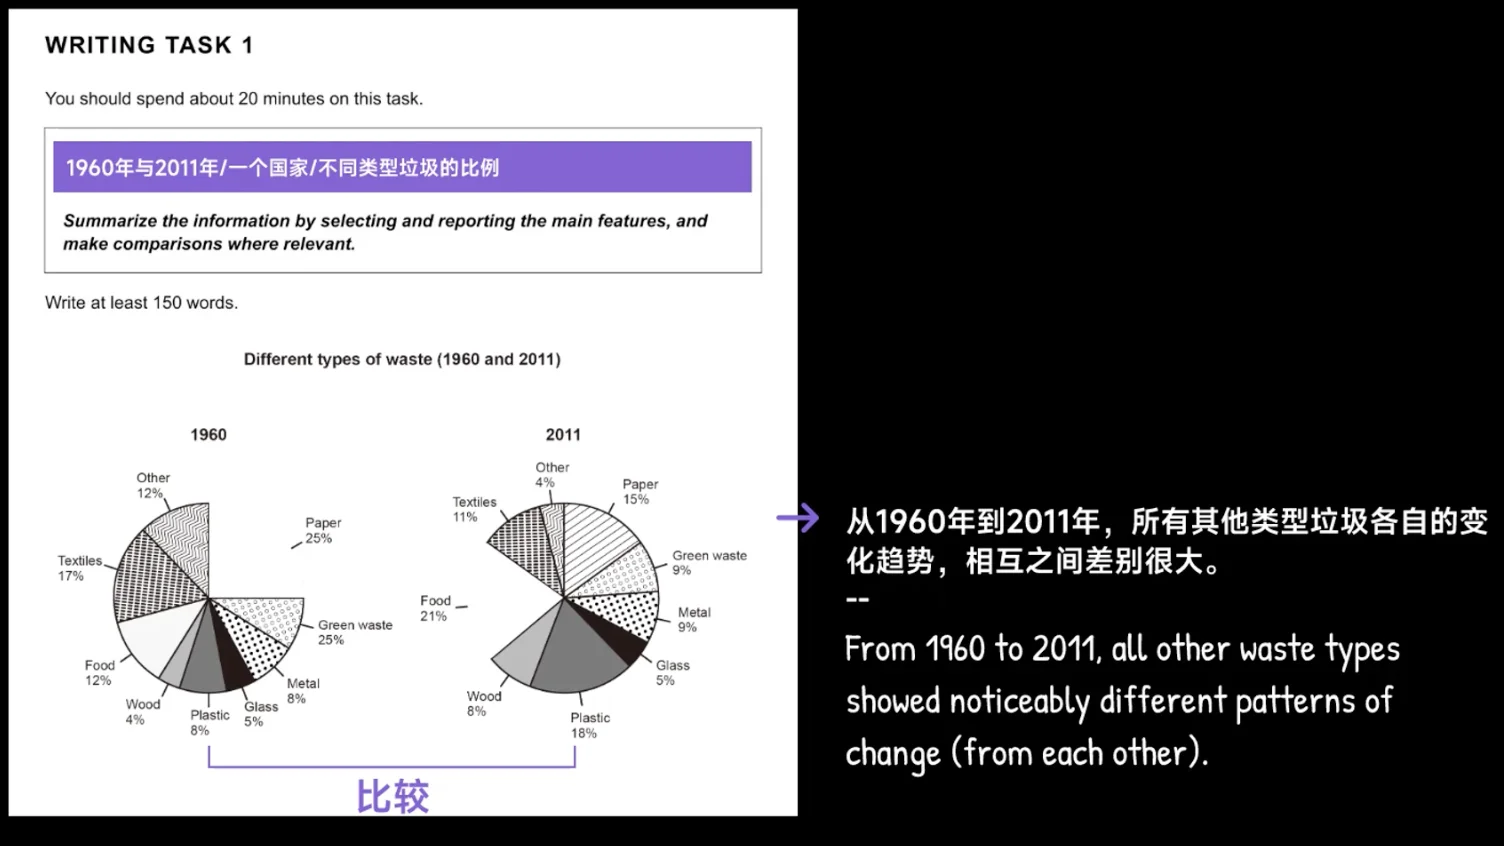
- 饼图 Pie Chart
- 表格 Table
准备要求 1 —— 题目要求 
图形介绍 
某个图 shows 某种数据
结构:一个核心词 + 多个修饰语
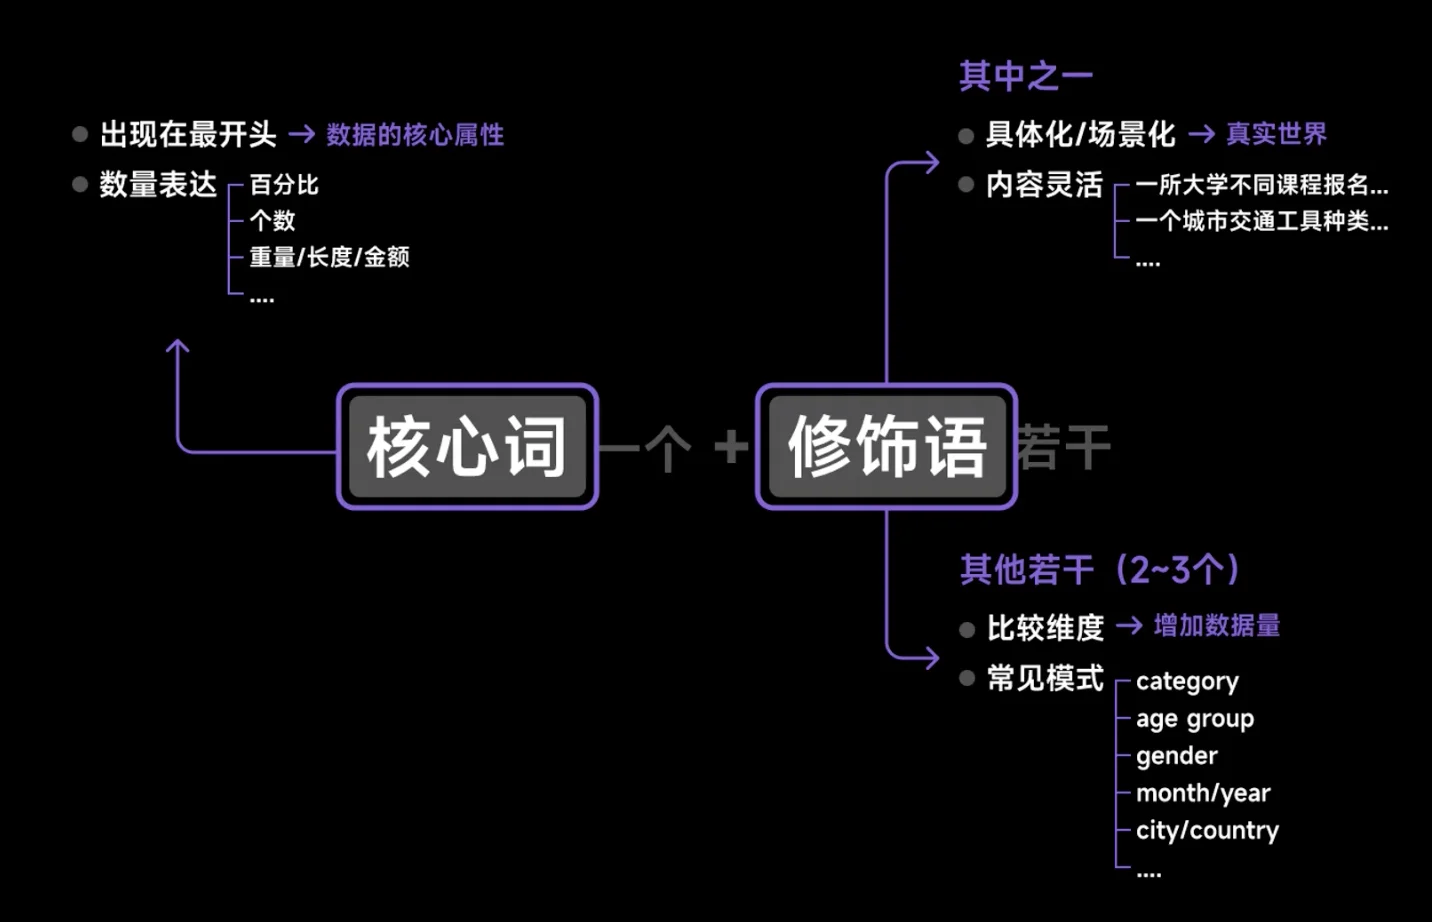
为什么要分修饰语:其实就是限定比较的组别和对象。需要从题目给定的数据当中找到比较维度
指令要求 

图表所有直观看到的内容 features
要做的三个动作:

准备工作 2 —— 动静分类 
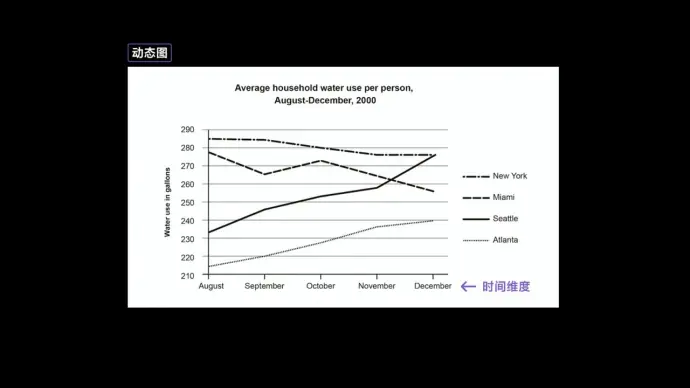
动态图:时间维度
- 不仅可以读取数值,还可以读取趋势
- 趋势分为:上升、下降、波动
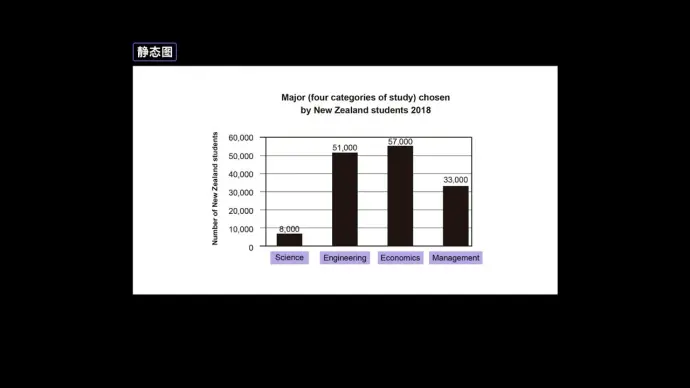
静态图:
- 只能读取数值
如何分段 
##

第一段为改写段进行同义复述句子数量看题目改
第二段为Overview 概述段 进行宏观概述,2~3 句话,看我们能概括出几点
第三段 & 第四段为Detail 细节段, 细节段分两段清晰一些


Para1: 改写段 
- 具体化 The graph
- 统一话术 give information about
- 照抄小标题
- 补充没写完的信息
- 如果有两个图,就重复一遍
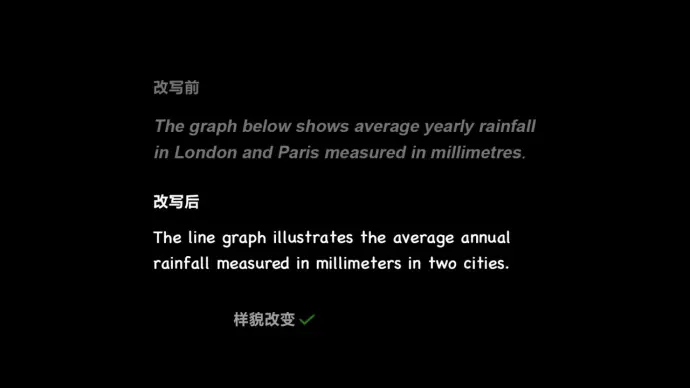
改写方法:
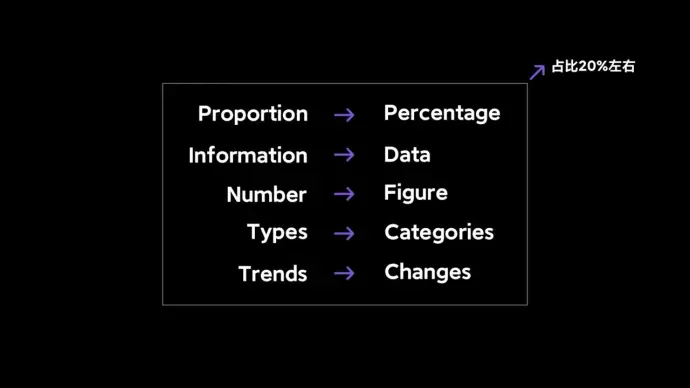
- 换词:描述性词汇同意替换
- 换位置:
- 概括
Para2: Overview 段 
三选二
另类的 
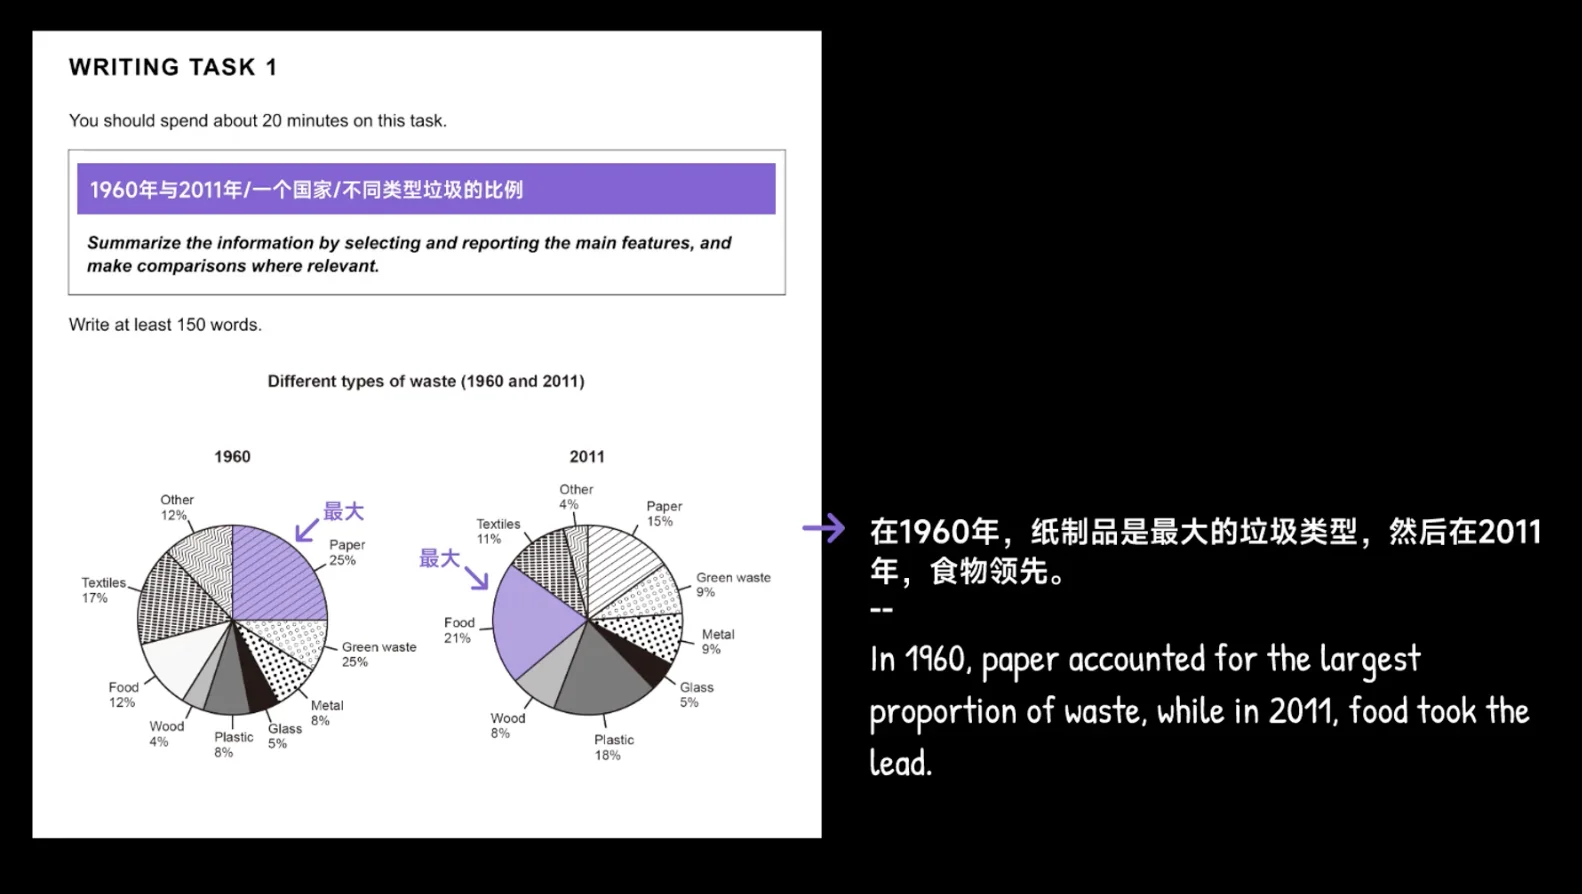
- 最大的部分
- 不一样的趋势
- 差距很大
统一的 
乱乱的 
注意 
- 不要写具体数值
- 引导词:
- Overall
- In sum
- in general
- 两点之间连接词
- Moreover
Para3&4: Detail 段挑选 / 分组 
如何抓细节 
回顾题目要求
summerize the information by selecting and reporting the main features and make comparisons where relevant
什么叫做 features?
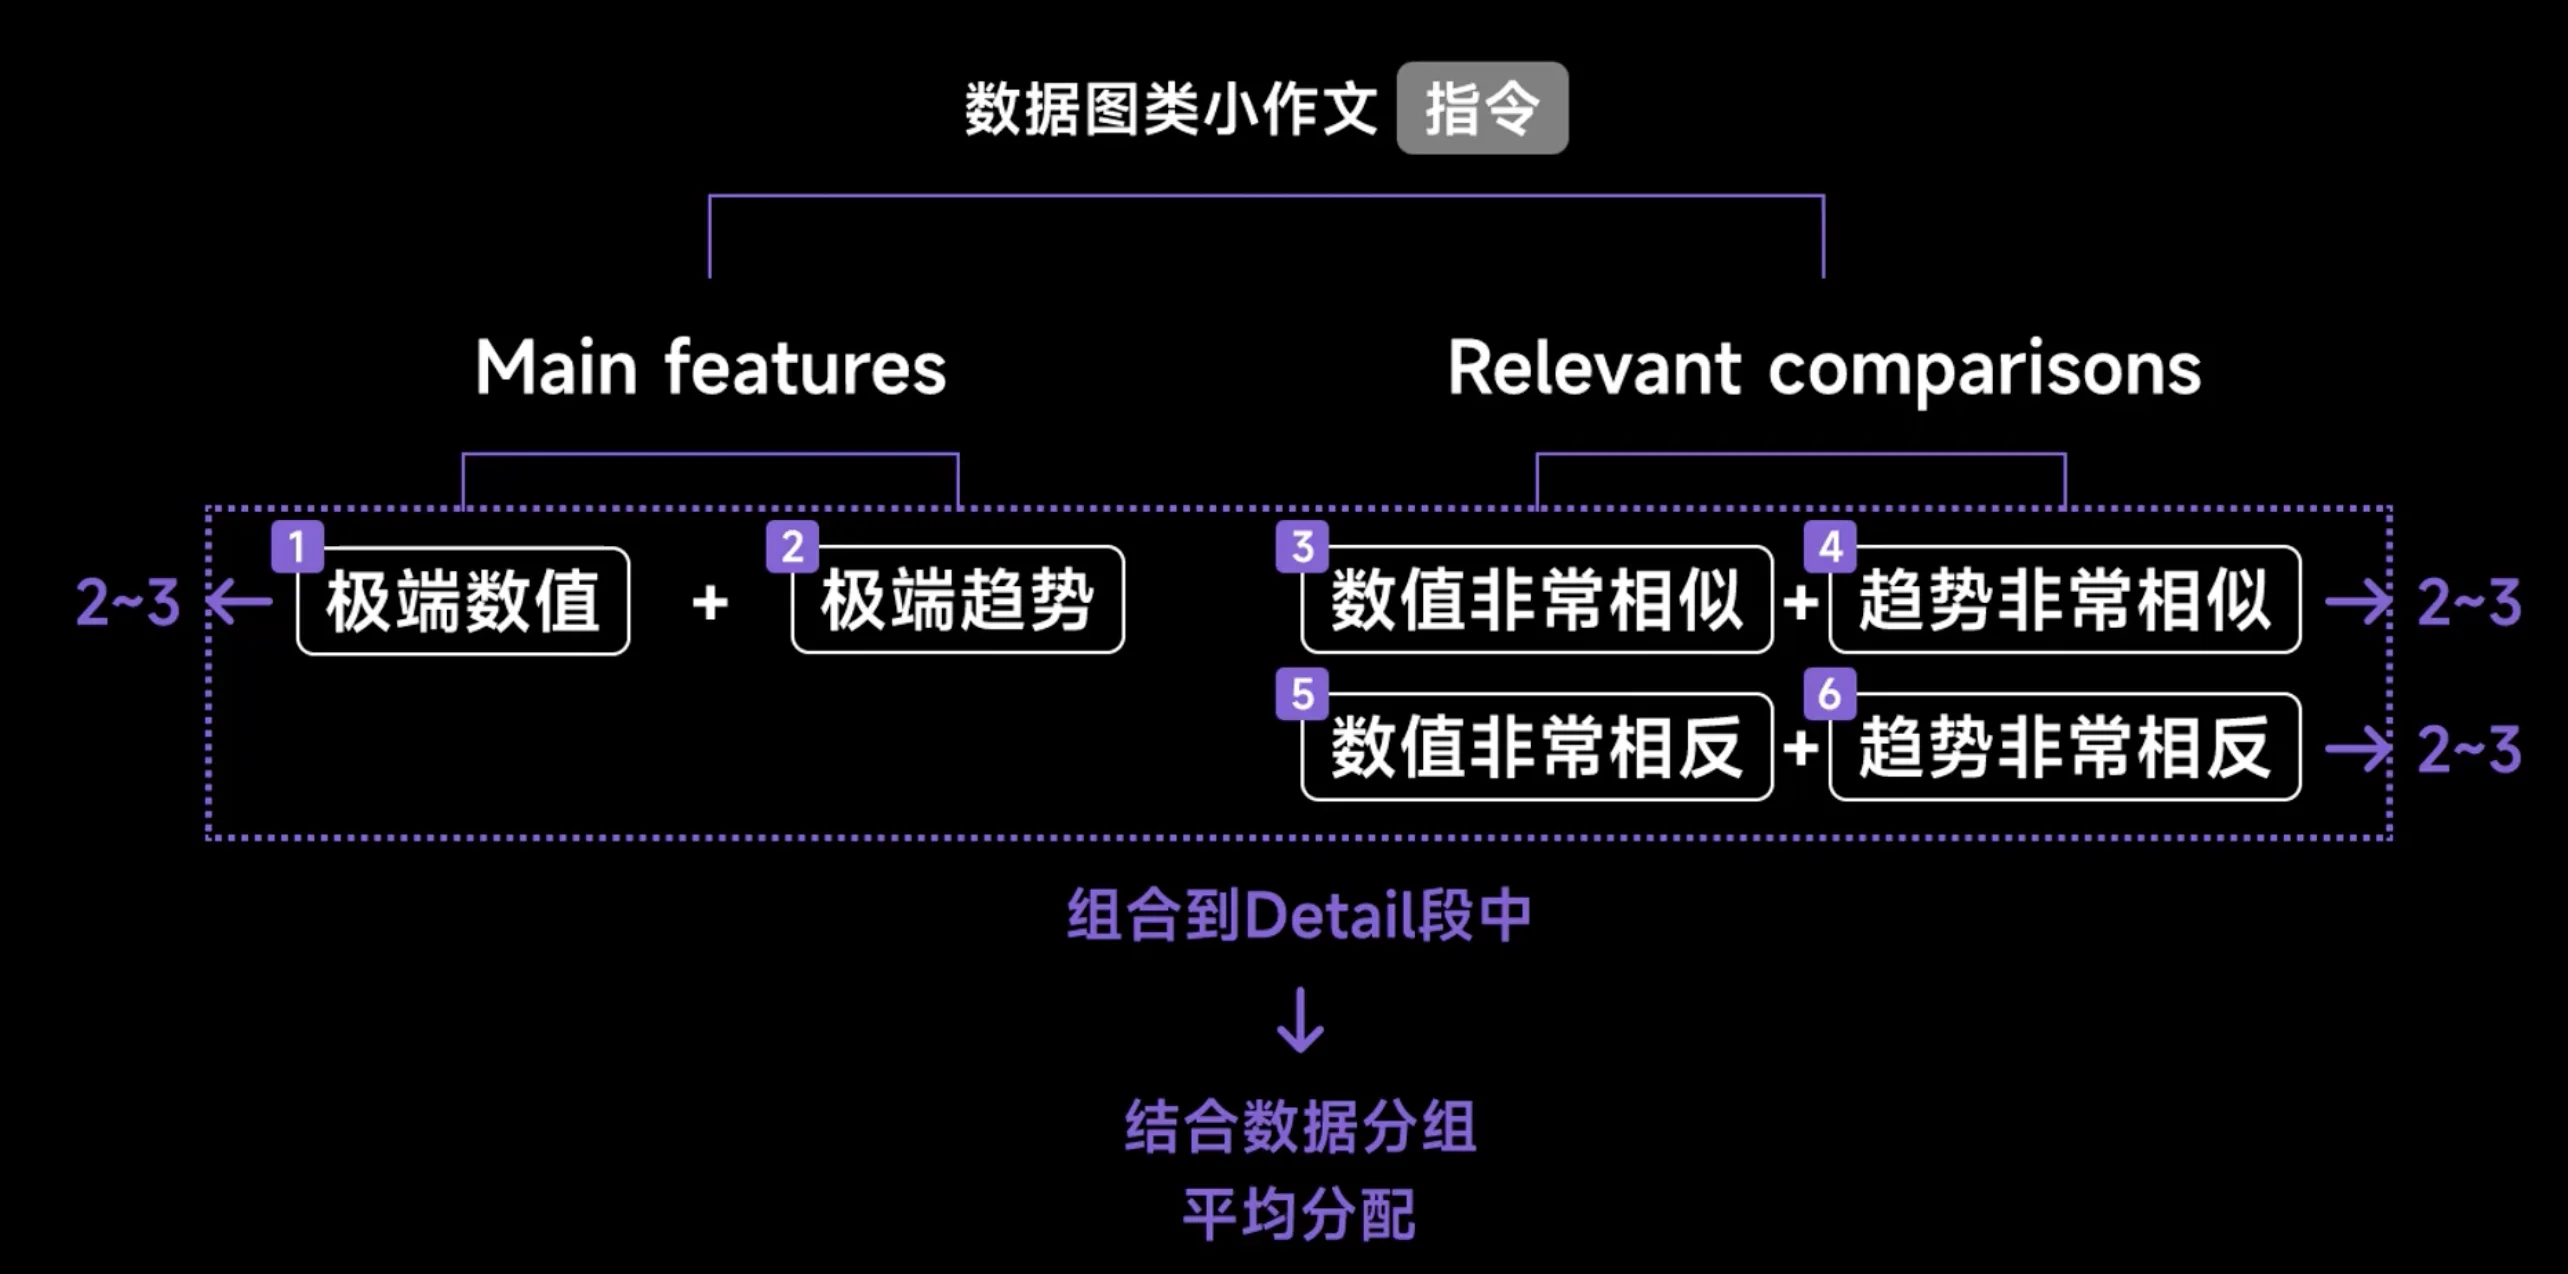
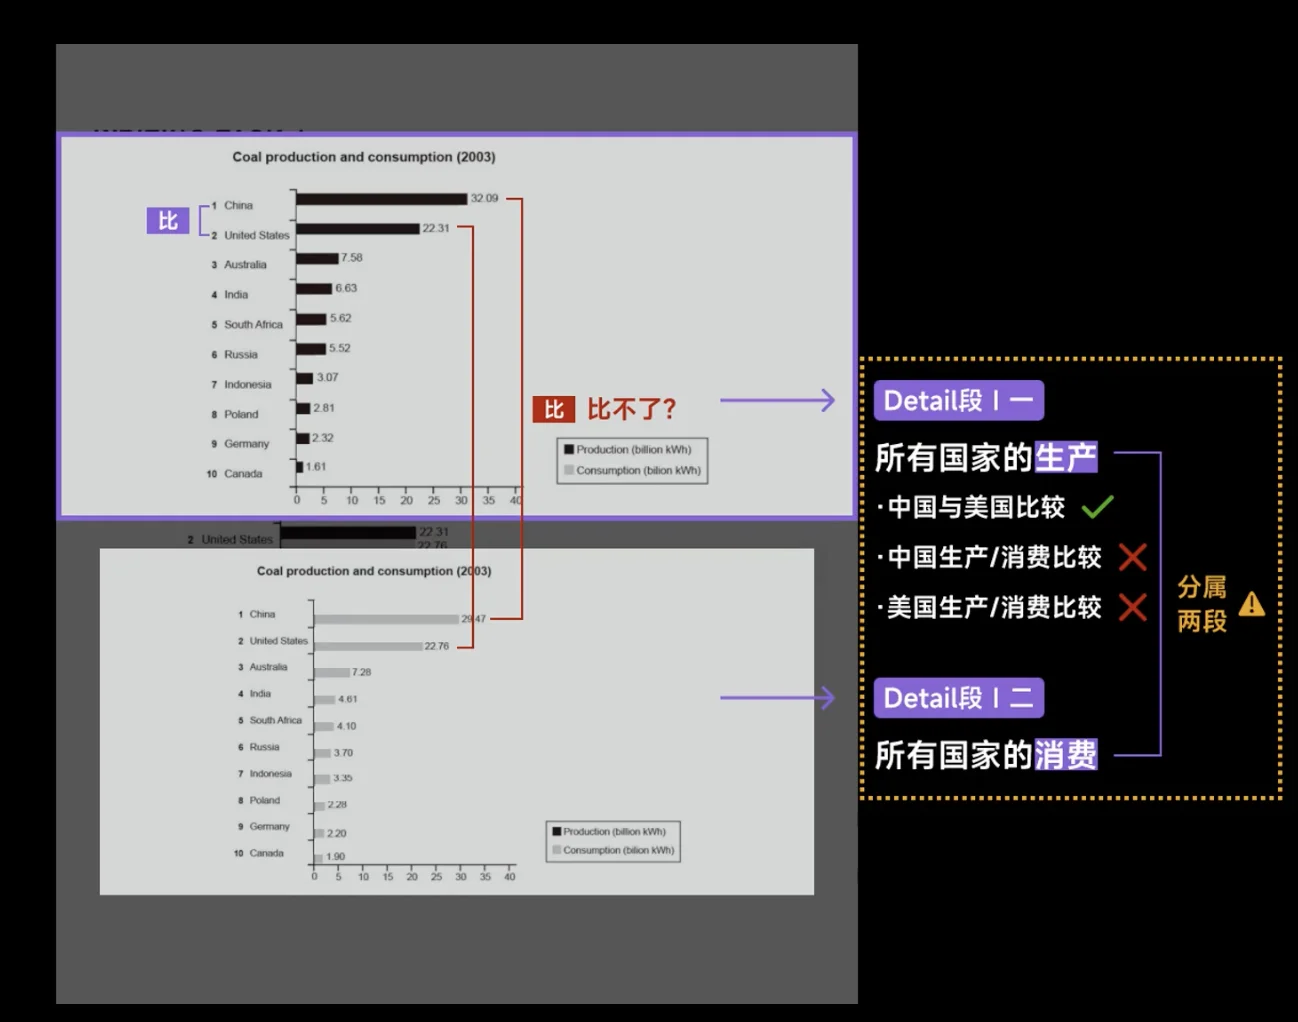
在做比较的时候要注意控制变量,一次只能比较一个变量
- 作比较的作用(第一维度
) :最大值、最小值、等值、差值、倍数、大于、小于
- 维度(趋势方面
) (只有动态图可以) :上升、下降、波动、稳定
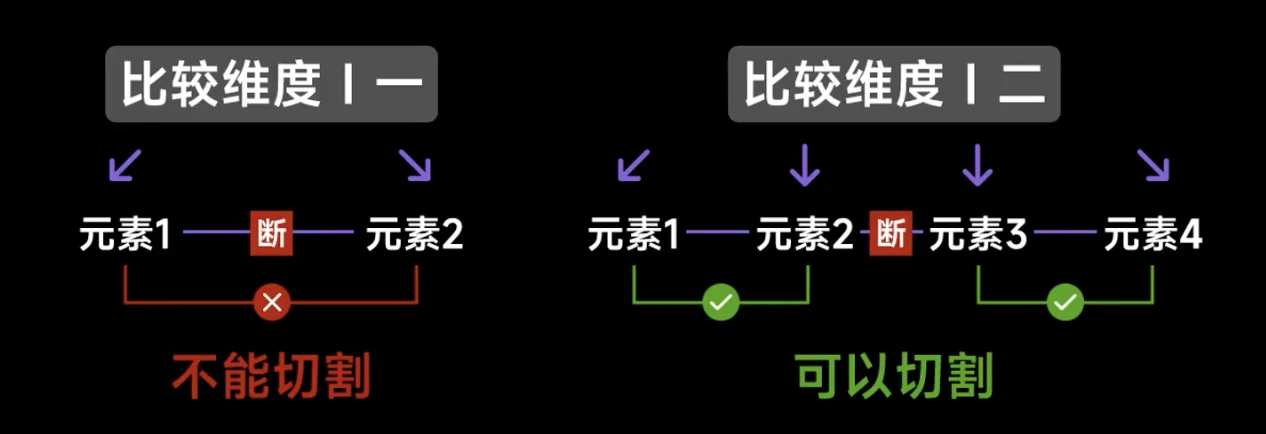
细节性内容分组 
但是需要注意不是每一个比较维度切分出来都是可以的。不能切割只有两个项目
引导词:
- 可以不写引导词
- 不相关的两个图形
范文 
改写段
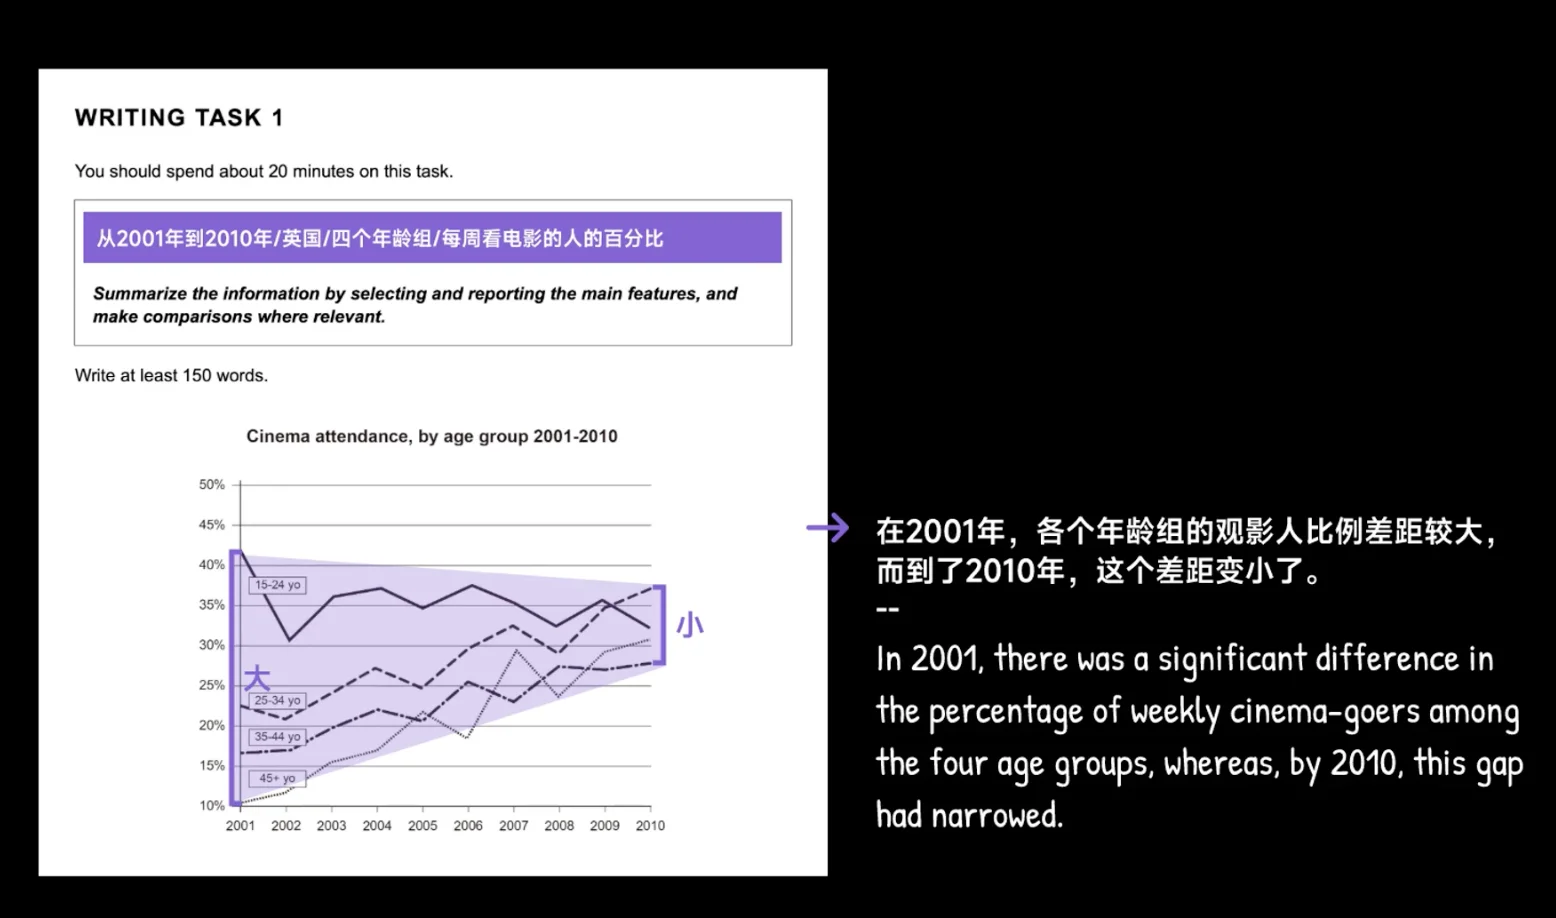
The line graph gives information about the weekly cinema attendance by age groups in the UK from 2001 to 2010.
Overview
Overall, in 2001, there was a significant difference in the percentage of weekly cinema-goers among the four age groups, whereas, by 2010, this gap had narrowed.
Additionally, three of the age groups showed an upward trend in this data over time.
Detail1
Concerning weekly cinema-goers under 35 years old, the 15-24 age group percentage peaked at around 42% in 2001, which was 10% higher than the figure in 2010.
In 2002, both the 15-24 and 25-34 age groups recorded their lowest points, although the latter was slightly lower at 21%.
Additionally, these two groups experienced a rise and then followed by a fall between 2001 and 2004.
However, from 2009 to 2010, these two age groups showed opposite trends: the former decreased, but the latter increased.
Detail2
Regarding age groups over 35 years old, between 2006 and 2007, the percentage of weekly cinema-goers aged 45 and above increased significantly, rising from less than 20% to nearly 30%.
In 2005, similar values were seen in the 35-44 and the 45+ age group, both around 22%.
The percentage of 35-44 year-old cinema-goers consistently increased from 2001 to 2004, after which it fluctuated noticeably.
Furthermore, after 2008, the figure for the 45+ group rapidly grew to over 30%; in contrast, the figure for the 35-44 age group remained relatively stable (at 23%).